
Finding the motivation behind a click: Definition and implementation of a website audience segmentation
Elena Villaespesa, Tate, UK, John Stack
Abstract
Understanding our audiences is a key element in the design of the digital experiences we offer. Our digital strategy principles aim for an approach that is audience centred and insight driven. The Tate website gets approximately 1.5 million visits a month, and while analytics and other tracking tools provide a huge amount of data about user behaviour on the website, there are some limitations in getting to know the motivations and experience behind a click. In order to get a better understanding of who comes to our website, we have carried out substantial research divided into two phases whose methodology and results is explained in this paper. The first phase consisted of the analysis of the motivations and usage of the online collection. There is a wide range of reasons behind the visits to this section of the website, from research to looking for inspiration or remembering with emotion an artwork seen during a gallery visit. Moreover, visitors have different levels of art knowledge; therefore, the information required and content needs vary. This audience-research work helped to define our second piece of research, a survey for the whole website aimed to better know our online visitors and, as a result, define a segmentation that classified website visits based primarily on the motivations driving users to the site, but also taking into account a set of variables such as knowledge of art, vocational connection, online behaviour, and the connection of a particular website visit with the gallery experience. The nine segments defined at the end of the research were: personal interest research, student research, professional research, inspiration, enjoyment, art news, repeat visit planning, first visit planning, and organisational information.Keywords: audience research, evaluation, segmentation, online metrics, visitor studies, insights
1. Context: Why we needed a website audience segmentation
In common with many cultural and heritage organisations, Tate’s insight into digital audiences is maturing and becoming a critical component in decision making and prioritisation. Tate’s digital strategy for 2013–15 outlines the organisation’s ambitions, and amongst these is the need to be “audience centred and insight driven” and to achieve this through “development of rigorous analysis of our digital offer” and “ensur[ing] that staff are empowered to use digital as part of their work,” including through appropriate knowledge of online audiences (Stack, 2013). By taking an audience-centred approach to developing Tate’s website (http://www.tate.org.uk), it is hoped that the organisation will reach new audiences and improve the experience for current audiences.
To develop this audience-centred approach, increasingly deep insight is needed into audiences that is both qualitative and quantitative. As with most websites, Tate analyses and reports quantitative Web metrics. In the early years of the website, server logfile analysis was used (which unhelpfully artificially inflated both visitor numbers and dwell time); since 2010, Google Analytics has been used. Summary metrics dashboards have been developed to report on quantitative metrics (Villaespesa, 2013). These dashboards have encouraged stakeholders and senior management to take a more sophisticated view of digital audiences by presenting a suite of metrics together and foregoing misleading metrics such as dwell time (since we design for some users to have quick visits and other to have long visits) (Villaespesa & Tasich, 2012). We have used analytics to segment our users and analyse the data, for example by location, device, traffic source, or content visited. While Google Analytics provides very detailed usage data, it does not provide insight into user needs and motivations, demographic information, or satisfaction levels. Only through qualitative surveys of users can this information be gathered and analysed alongside the quantitative data providing a comprehensive picture of digital audiences. “Early” surveys of Tate’s website users (c. 2005–10) focused on high-level satisfaction of website users, gauging awareness of sponsors and defining some short-term improvements to awareness of the website’s offering. The outputs of these surveys were communicated internally and externally primarily as advocacy for the website and for the partnership with the sponsor. Thus, the main decisions made from the outputs of these surveys were tactical ones related to enhancement of website navigation, and the survey results did not impact in a substantial way on content development, the strategic approach to website audiences, or on activities outside of the Digital Department (then Tate Online Department). Tate has heavily invested in its website since the early 2000s, resulting in a site that is comparatively large and offers a wide range of content for a diverse range of audiences, including:
- Digitised art collection (more than seventy-thousand artworks) online and with the digitised Tate Archive being integrated from late 2014 (more than fifty-thousand pieces by summer 2015)
- Comprehensive event, exhibition, and display listings
- Visiting information for all four Tate galleries (five including the Barbara Hepworth Museum and Sculpture Garden)
- Blogs that range from specialist areas of museum work to lighter introductory pieces for broad audiences
- Short-form magazine-style videos and long-form recordings of public programmes at Tate’s auditoriums
- Learning resources, including teachers’ packs, online courses, and educational site sections on individual artworks and artists
- Tate Kids, a website for children
- Tate Collectives, a website for young people
- Information and transactions for Tate’s members and patrons schemes
- Collection research publications and the online journal Tate Papers
- User-generated content initiatives, including the Albums feature and Art Maps
- Corporate information, including job listings, press releases, and annual reports
- An online shop, e-books, and apps
There is a rolling programme of projects to overhaul individual site sections and features, and as each area is refreshed, focused online surveys of users of that section are used to analyse their needs, alongside quantitative data such as heatmaps and Web metrics (Google Analytics), to inform that work. The diversity of Tate’s Web content for online audiences demonstrates the extent to which the organisation considers website audiences as important as those that visit the galleries (indeed, the number of online visitors has exceeded physical visitors for many years). However, such a diverse website offer is prone to fragmentation resulting in a poor user experience, exacerbated by the fact that—in contrast with those of, for example, a university website—many of the audience’s needs and associated user journeys overlap. Tate’s digital roadmap for the forthcoming years envisions a much improved and more seamless user experience across the organisation’s website, social channels, content delivered via the galleries’ Wi-Fi networks, apps, and e-mail. This user experience covers both website audiences who are before, during, or after a visit, but also those whose website visit is unrelated to a visit to one of Tate’s galleries. The Digital Department holds responsibility for delivering this holistic and high-quality user experience. However, most content development, decision making, and, importantly, resource delivering for Tate’s digital output sits in departments across the organisation. These departments are increasingly commissioning Web content and initiating digital projects, many of which are self-contained, temporary, and externally funded.
The delivery of a high-quality user experience for website visitors is therefore fraught with challenges originating from the lack of a deep understanding of digital audiences and their use of Tate’s website. The result is that the digital offer can, instead of being designed to fulfill clearly defined audience needs, reflect the organisation’s structure, different departmental objectives, and the multitude of content and product production workflows. On the whole, the business needs of website initiatives are well defined. However, website audience needs are not well understood, and it is not unusual for a proposed website initiative’s audience to be defined as “everyone” or for audience needs to be based on generalisations or assumptions. To take the audience-centred approach that will deliver the high-quality and holistic user experience to which Tate aspires will require both defining audience’s needs clearly and communicating them to internal stakeholders to encourage them to align their activities with fulfilling those needs. There is therefore a pressing need to create a shared language for digital audiences that can be the foundation for forthcoming work. The objectives of the 2014 website audience research were to:
- Improve user experience, recognising that there are multiple user types who use the website differently and even use some of the same features of the site differently (notably, site search and “Art & artists”)
- Understand better who our users are, and enable us to communicate this within the organisation
- Understand the role of the website in a physical gallery visit
2. Methodology for creating the segmentation
The usage of the range of tools and methods mentioned above helped us to monitor trends and evaluate how the website is performing. They also gave us some pointers about our audiences, but we needed further research to fill in some data gaps and define a website visitor segmentation. While the usage of some sections of the website like the “Visit” or “What’s on” pages was quite clear, the motivations and the experience relating to the online collection (“Art & artists”) was unknown. Therefore, we decided to divide the research work into two phases. The first phase consisted of a short survey on the online collection that aimed to understand the motivations and usage of this section (Villaespesa, 2014). The survey included three questions: one open question asking visitors why they had come to visit the online collection; one asking them to choose from a list which actions they had performed during their visit (search for a particular artwork/artist; find out everything Tate has about a subject, category, or art movement; read text associated with an artwork/artist; download an image; find out the works on display in the galleries; use the slideshow; share art on social media); and a final open question asking for feedback.The survey was live for one week in January 2014 and received 670 responses. The responses to the first question were coded into different motivational categories. Although there were some limitations relating to amount of detail provided in response to the open question, we were able to identify the key motivations and usages of the visitors.

Figure 1: screen grab of the short survey on “Art & artists”
The second phase, informed by the online-collection audience research, was a survey on all non-transaction website pages that investigated motivations further and linked these to other variables. The survey took place over two weeks in March 2014, and the popup invitation appeared to visitors who had been on the website for over two minutes. This time condition may have excluded some types of visit, but at this stage we were interested in getting responses from those who had been on the website for a while in order to capture what they visited and how satisfactory their experience had been. Another limitation worth mentioning is that because of data-protection rules, survey respondents needed to be over sixteen years old, so that excluded visits from children to our popular games and other content for this audience. During the two-week period, 1,992 surveys were completed.
3. Defining the segmentation
We examined the survey results from different angles in order to determine the best segmentation approach that would better meet our research objectives. The analysis of the data clearly demonstrated a series of variables that defined the typology of website visits. This section of the paper will explain in detail these variables.
Motivation
Motivation has been used by different museum practitioners and researchers (Falk, 2009; Morris Hargreaves McIntyre, 2004; Pekarik, Doering, & Karns, 2010) as a way to segment gallery visits, and is a key element in the definition of our gallery segmentation at Tate. Motivational segmentation has also been applied for website visits (Haley & Schaller, 2004). An example of this is found at the Indianapolis Art Museum (Filippini, Stein, & Bowman, 2012), which identified five main reasons that motivate people to come to their website. Based on this work, twenty cultural institutions ran a similar study as part of the Let’s Get Real project (Malde, Finnis, Kennedy, Ridge, Villaespesa, & Chan, 2013). Our research showed that motivation was a key variable that influenced the needs, expectations, and behaviour of users, and we found a varied range of motivations in visiting Tate’s website. While most of the users come for intellectual purposes, this actually encompasses a range of learning and research objectives, educational levels, and habits. The second largest group of visits are those related to visit planning—users checking what’s on and practical information such as opening times, location, or building facilities. In a lower percentage of visit modes, we can find visitors seeking inspiration or looking for a more aesthetic and emotional experience—browsing through images and other art visual content. Other motivations to visit the website include users searching for art news or looking for organisational information about Tate.

Figure 2: wordcloud of the motivations described by users to visit the website
Knowledge of art and vocational connection
Visitors to the website have different levels of art knowledge. While 30 percent of our visitors see themselves as having a specialist knowledge of art, 70 percent have little or a general knowledge of the topic. Their needs and expectations vary depending on their knowledge. We should keep this in mind to provide different ways for our visitors to enjoy and understand art, as well as options for users to create their own experience and meaning. Furthermore, the knowledge-of-art variable is highly correlated to visitor’s vocational connection with visual arts and museums. Users who have a relationship with the sector (studying, teaching, or professional) tend to have a higher knowledge of art, and their content needs are more precise as they are likely to be searching for homework resources, teachers’ packs to prepare a class or a visit, or in-depth articles about specific subjects. In contrast, those users with no connection with visual arts or museums are more likely to have little or no knowledge of art. As a result, their expectations are lower, and they have a less structured agenda than other users researching, so layered content and packaged experiences help them to navigate through the site. In the development of the segmentation, vocational connection ended up being the key variable that divided the users who came with an intellectual motivation to learn and increase their knowledge of art.

Figure 3: vocational connection

Figure 4: knowledge of art
Relationship with Tate’s website
Whether the user is a frequent visitor to the website or knows the galleries well has an impact on their experience navigating and browsing the site to find what they are looking for. Regular users know the website and learn how to navigate through it. However, the challenge is to take them on unexpected journeys and show them new content or functionalities added to the website. The majority of Tate users are regulars, with 70 percent of all visits to the website made by a small proportion of regulars. These users tend to be arts professionals, students, or teachers. First timers represent 20 percent of all visits and approximately half the users. These users are likely to be from outside the United Kingdom or are less likely to be art specialists.
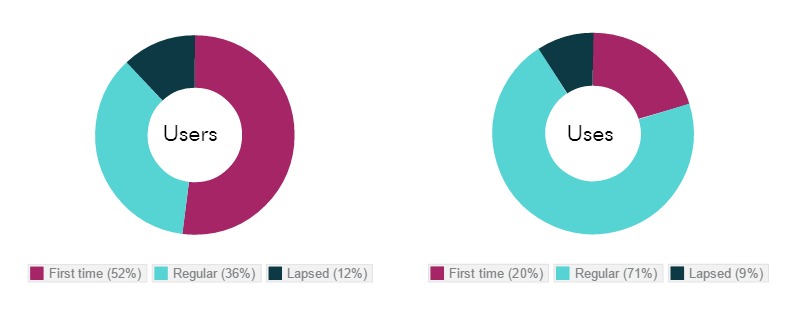
Figure 5: proportion of first time, regular, and lapsed users and uses
Role of the website in the visitor journey
The context of the website visit determines a series of specific needs. One of the objectives of the research was to understand the role that the website plays in the visitor’s journey before, during, and after the gallery visit. Roughly half of the visits to the website are related to a gallery visit. Our visitors use the website as a planning tool to see what’s on, research general visiting information—opening times, location, or gallery facilities—and check which artworks and artists are on display. When they are in the galleries, increasing numbers of visitors are connecting to Wi-Fi and using their mobile phones to access the website to learn more about the art they are seeing or to check what’s on. After the visit, people return to the website to look up images, remind themselves about the artworks they have seen, or find more information on artworks and artists. The website is used in this scenario as a way to extend and enrich their gallery visits. There are notable opportunities in providing a more linear and cohesive experience using technology that can enhance the visitor journey in these three phases: during the planning, the physical visit, and after the visit.

Figure 6: role of the website before, during, and after the gallery visit
4. The website audience segmentation
The nine segments defined at the end of the research are: personal interest research, student research, professional research, inspiration, enjoyment, art news, repeat visit planning, first visit planning, and organisational information. As the segmentation is primarily based on motivation, the same user can be in one type of visit mode on one visit to the website and be in a different one on another visit. Therefore the segmentation defined here is a typology of visits (sessions) to the Tate website.

Figure 7: website audience segmentation
Personal interest research (16 percent)
These visitors come to the website to learn and gain knowledge to satisfy their art interest and hobby. They have a general knowledge of art and no vocational connection with the arts sector. They tend to arrive on the website through looking for art terms on search engines, and although they will methodically navigate through the website, they don’t know what they are looking for or what to expect.
Student research (17 percent)
Visits from these users are driven by study and research reasons. They are looking for help for a school or university project. By definition they are studying in visual art or museums. This group are heavy users of our “Art & artists” section and will also search for related art content, especially homework resources. A large proportion of the student research visit mode are young and come from the United Kingdom. This group is more active than others in following Tate on social media. The levels of study breakdown as follows: GCSE (a qualification typically taken by UK school students aged 14 to 16) (3 percent), A-level (a qualification at a higher level than GCSE typically taken by UK students aged 16 to 18) (19 percent), undergraduate (52 percent), master’s (12 percent), Ph.D. (7 percent), and other (7 percent).
Professional research (14 percent)
These visitors are either professionally connected to the arts or are teachers in the arts who come to the website to further their already deep art knowledge. Compared to the other segments, these group members are significantly more likely to be specialists in art. The arts are essential to their life; they have eclectic taste in the arts and like to be at the cutting edge. They are the most methodical of the users and come with a purpose—mainly to search our online collection and visit other specialist content such as research papers, articles, and teaching resources. Thirty-five percent of the users of this group are teachers, and the levels of teaching are as follows: university (52 percent), secondary (GCSE level) (21 percent), primary (2 percent), sixth form (A-level or equivalent vocational course) (7 percent), and other (17 percent).
Inspiration (8 percent)
These users come to the website with a range of motivations. Generally, they can be considered as coming for a visceral and largely aesthetic experience. They are hoping for detail and quality and want high-resolution images. This is a “virtual visit” and may serve as a substitute for a gallery visit. They are more than likely hoping for an emotional or nostalgic experience. Their agenda is therefore open and pleasure driven.
Enjoyment (2 percent)
This type of visit to the website is driven by a desire to have fun by playing games, participating in quizzes, or looking for and entering competitions. This group are also using the website as a social resource—either by commenting on blogs or finding aspects of the site to share with their friends on Facebook or Twitter.
Art news (3 percent)
For these users, art is essential to their lives. Their visit is predominantly centred on finding out about new and upcoming exhibitions to stay ahead of the curve, as well as discovering what’s new—even if they are not planning a visit. They also use the website as a way to keep up with art news in general, either by looking up artists and artworks or reading articles.
Repeat visit planning (27 percent)
The majority of users in this visit mode are regular gallery attenders using the website to find out about current and upcoming exhibitions and book their tickets. They are already familiar with the permanent offer of the galleries. They are predominantly from the United Kingdom, with 46 percent originating in London. They have a strong emotional tie with Tate and are regular website visitors.
First time visit planning (14 percent)
Users in this visit mode are driven to the site to find out general visitor information for a first time, or lapsed, visit to Tate. They are also looking for information about what’s on. They need information about what they can expect to see, as well as opening times, prices, parking, and travel information. There is a fairly even split between those from the United Kingdom and overseas. Compared with users in a repeat visit planning mode, users in a first time visit planning mode are likely to have less specialist knowledge of art or museums.
Organisational information (4 percent)
People in this group are on Tate’s website to find out about working or volunteering at Tate, followed by looking up business information and finding out more about the work that Tate does. The majority have a professional connection with the arts; they are from both the United Kingdom and overseas.
5. Ongoing analysis of the segmentation: Monitoring trends over time
The volume of visits to the website varies depending on factors such as the academic year, the exhibition programme, gallery news, and content going viral on social media. Although we tried to minimise the impact of these conditions to get a representative sample of all types of visit, it is important to acknowledge that the percentage of these visit types may vary through the year and that monitoring these on a regular basis will help to see how these segment proportions change over time. A final output of the research work was the development of a set of “golden questions” that help to classify the visit into one of the segments. Since August 2014, we have used these golden questions to run on an ongoing basis a short survey that shows to a small percentage of our visitors during two weeks of each month. The survey also includes an open question where users are invited to give us feedback to improve the website.

Figure 8: website visits by segment based on the ongoing short survey results (August 2014 to January 2015)
Apart from helping to understand and monitor the variations of the proportions that each segment represents over time, this survey is integrated with our analytics tool, which means that the responses are recorded along with visit metrics such as average time on site, pages per visit, or percentage of new visits. Therefore, we can also track these variables to measure the changes on their experience derived from website modifications. Finally, the open question gives us specific feedback that we can use to address and improve the experience of each of the segments.
6. Next steps: Implementing the segmentation
In the absence of an online audience segmentation, the organisation was operating using presumptions about online audiences. The ultimate goal of having a website-visits segmentation is to have a shared language that is used across the organisation and to use the segments to embed an audience-centred approach. Thus, in the future, all digital activities would ideally have clearly defined target audiences and objectives from the beginning of the production process.
Internal communication
To achieve this, once we had defined the segmentation, we undertook a communications initiative to share the results of the research and to explain the characteristics of each of the segments across the organisation. The dissemination work included a presentation to all Tate staff; tailored presentations to individual departments’ meetings; circulation of the report via Tate’s intranet and via e-mail; infographics with key website data and for each of the segments; snapshots of data in monthly digital analytics e-mail updates; and the creation of an internal audience data dashboard on the intranet. We also produced a leaflet with details of the portrait of each visit mode, which features a series of characteristics particular to that segment: motivation, content interests, visit frequency, knowledge of art, vocational connection, relation with the gallery visit, demographics, and other online-behaviour attributes. A copy of this leaflet has been distributed to each Tate employee and will be given to new staff during their welcome and induction session. A more detailed explanation of the segments is also presented during our digital training programme, which aims to increase the digital skills and knowledge of our audiences of Tate staff. The segments are also introduced into the organisation informally in contexts where they will add value to discussions, such as when reporting on existing digital activities and scoping new digital activities. Members of the Digital Department refer to the segments and the underlying data to help shape digital projects with colleagues, question long-held assumptions about online audiences, and hold more informed discussions about forthcoming priorities.
Digital department workshop and website development roadmap
In order to identify desirable changes to the website that followed from the audience needs outlined in the newly created segmentation, we also held a workshop in the Digital Department in which we analysed the different visit modes. We first described the ideal experience for each type of visit and then started a discussion to address these questions:
- Are we serving these users well?
- How can we improve the website to meet their needs and deepen engagement?
- What are the key digital initiatives in our plan?
- What are the challenges and opportunities?

Figure 9: Digital Department workshop
This brainstorming activity helped us to develop a clear strategy for each segment, establishing how we can provide the best possible experience to the visitors and also take them through surprising journeys that can potentially increase their engagement with Tate. As resources are limited, implementing all these ideas would be almost impossible, so we carried out a prioritisation exercise during the workshop to shape our purpose and production activities for the coming year. The exercise consisted of placing each segment in a matrix defined by our strategic priorities and the current user experience. The result gave us a clear and narrow focus on the key areas to work on in order to impact the production planning.

Figure 10: work in progress during the prioritisation exercise
Those with a specialist knowledge, such as professional researchers, are mostly well served with content and will work hard to find what they are looking for. To improve their content-discovery experience, we have overhauled the browse and advanced search features of the online-collection interface and are adding additional onward links from artworks and artist pages to related content such as articles, films, and learning resources. For these users, we will also increase the discoverability of research publications and teaching resources. For student researchers, we are comprehensively reworking the sections of the website for young people, investigating how to more closely align what we offer online with the education curriculum and creating journeys that allow them to discover new art content in each visit.
Those with a more general knowledge (personal interest research) are currently underserved, and recent initiatives for them have focused on generating content (blog posts and other time-bound content) that does not have a long lifetime, does not rank highly in search, and relies heavily on promotion for discovery followed by a rapid decline in views. We are now investing resources in building packaged and layered content for this audience, such as extending and enriching the online glossary of art terms (following a trail on the popular Pre-Raphaelites page), and adding resources and landing pages targeted at frequently searched terms such as “Turner” (Tate collection includes very extensive holdings of J.M.W. Turner) and “Turbine Hall” (a large exhibition space at Tate Modern that has been the location of numerous art installations, performances and events) and ensuring that these rank well in search engines and the website’s search.
For the two visit segments of the website, we are planning to overhaul the “Visit” and “What’s On” sections of the website, with a particular focus on the two distinct areas of need identified by the research. As part of this work, we plan to overhaul Tate’s online calendar and events listings, improve the use of digital for wayfinding and discovery of which artworks are on display, and provide digital services for use in gallery for repeat visitors. For first time visitors, we plan to better articulate what each of the galleries offer—especially the two London galleries, Tate Britain and Tate Modern—and provide introductory resources for a first gallery visit. For repeat visit planners, we will provide efficient and intuitive pages for visit planning and make the most of the loyalty to Tate with an engaging post-visit experience.
For the art news segment, we are increasingly seeking to ensure that stories communicated to the media via press releases are also presented on our own website and social channels in the form of news stories and blog posts. For the organisational information segment, we are increasingly asking colleagues to share their deep expertise and knowledge online through blogs and sharing of internal policy and procedure documents where possible. For the inspiration segment, a list of possible new interactive ways of exploring the online collection has been produced, including browsing by colour, mood, and serendipity. For the enjoyment segment, there will be a focus on games and fun experiences to enjoy art on the website and social media platforms.
Embedding the segments in the organisation’s digital activity
Finally, we see an opportunity for Tate to fully embed the website-visit segments by structuring the website’s roadmap around them, ensuring that the Digital Department’s content and production output are aligned with this roadmap by assigning individual team members to work on delivering on each segments’ needs, and ensuring new initiatives deliver on these needs by incorporating them into the processes for commissioning content. Progress on delivering such a roadmap could be measured through adjusting the website’s key performance indicators (KPIs) to reflect delivery against the roadmap of delivering the website audience segment needs.
7. Conclusion
This paper contributes to the studies of classifying museum website users. In this case, based on the objectives of the research, a motivational segmentation was the necessary approach. The first steps in its implementation validates this classification method for the purpose of understanding and improving Tate website user journeys and experiences. The data also shows how this segmentation is aligned with the previous audience research and work, and how it is being reflected in analytics giving a sense that is correct. Further work using this methodology or experimenting with other variables will continue the discussion about ways to profile website users and will set the ground for drawing comparisons among different cases within the museum sector.
Acknowledgements
We would like to thank Morris Hargreaves McIntyre for their consultancy work during the second phase of this research project and Sabine Doolin, Audience Research and Insight manager at Tate, for her advice and input. Thanks also to our colleagues in Tate’s Digital Department for their feedback during the development of the segmentation, and to Maggie Hills for proofreading this paper.
References
Falk, J. H. (2009). Identity and the museum visitor experience. Walnut Creek, Calif: Left Coast Press.
Filippini, F. S., R. Stein, & G. Bowman. (2012). “Exploring the Relationship Between Visitor Motivation and Engagement in Online Museum Audiences.” In N. Proctor & R. Cherry (eds.). Museums and the Web 2012: Proceedings. San Diego: Archives & Museum Informatics. Consulted September 30, 2014. Available http://www.museumsandtheweb.com/mw2012/papers/exploring_the_relationship_between_visitor_mot
Haley, K. H., & D. Schaller. (2004). “Exploring Motivational Factors and Visitor Satisfaction in On-Line Museum Visits.” In J. Trant and D. Bearman (eds.). Museums and the Web 2004: Proceedings. Toronto: Archives & Museum Informatics. Consulted September 30, 2014. Available http://www.archimuse.com/mw2004/papers/haleyGoldman/haleyGoldman.html
Malde, S., J. Finnis, A. Kennedy, M. Ridge, E. Villaespesa, & S. Chan. (2013) “Let’s get real: A journey towards understanding and measuring digital engagement.” WeAreCulture24. Brighton: Culture24. Consulted September 30, 2014. Available http://weareculture24.org.uk/projects/action-research/
Morris Hargreaves McIntyre. (2004). Tate through visitor’s eyes, An anatomy of a visit. Report.
Pekarik, A. J., Z. D. Doering, & D. A. Karns. (2010). “Exploring Satisfying Experiences in Museums.” Curator: The Museum Journal 42: 152–173.Stack, J. (2013). “Tate Digital Strategy 2013–15: Digital as a Dimension of Everything.” In Tate Papers, Issue 19. Consulted January 16, 2015. Available http://www.tate.org.uk/research/publications/tate-papers/tate-digital-strategy-2013-15-digital-dimension-everything
Villaespesa, E. (2013). Tate Digital Metrics Dashboard Template. Consulted January 23, 2015. Available http://www.tate.org.uk/file/digital-metrics-dashboard-template
Villaespesa, E. (2014). Understanding people’s motivations and usage of the online collection. Digital audience research report, Tate. Consulted January 23, 2015. Available http://www.tate.org.uk/download/file/fid/37523
Villaespesa, E., & T. Tasich. (2012). “Making Sense of Numbers: A Journey of Spreading the Analytics Culture at Tate.” In N. Proctor & R. Cherry (eds.). Museums and the Web 2012: Proceedings. San Diego: Archives & Museum Informatics. Consulted January 22, 2015. Available http://www.museumsandtheweb.com/mw2012/papers/making_sense_of_numbers_a_journey_of_spreading
Villaespesa, E., S. Doolin, & J. Stack. (2015). Tate Website Audience Segmentation. Available http://www.tate.org.uk/file/
Cite as:
. "Finding the motivation behind a click: Definition and implementation of a website audience segmentation." MW2015: Museums and the Web 2015. Published January 30, 2015. Consulted .
https://mw2015.museumsandtheweb.com/paper/finding-the-motivation-behind-a-click-definition-and-implementation-of-a-website-audience-segmentation/